
lightdash download

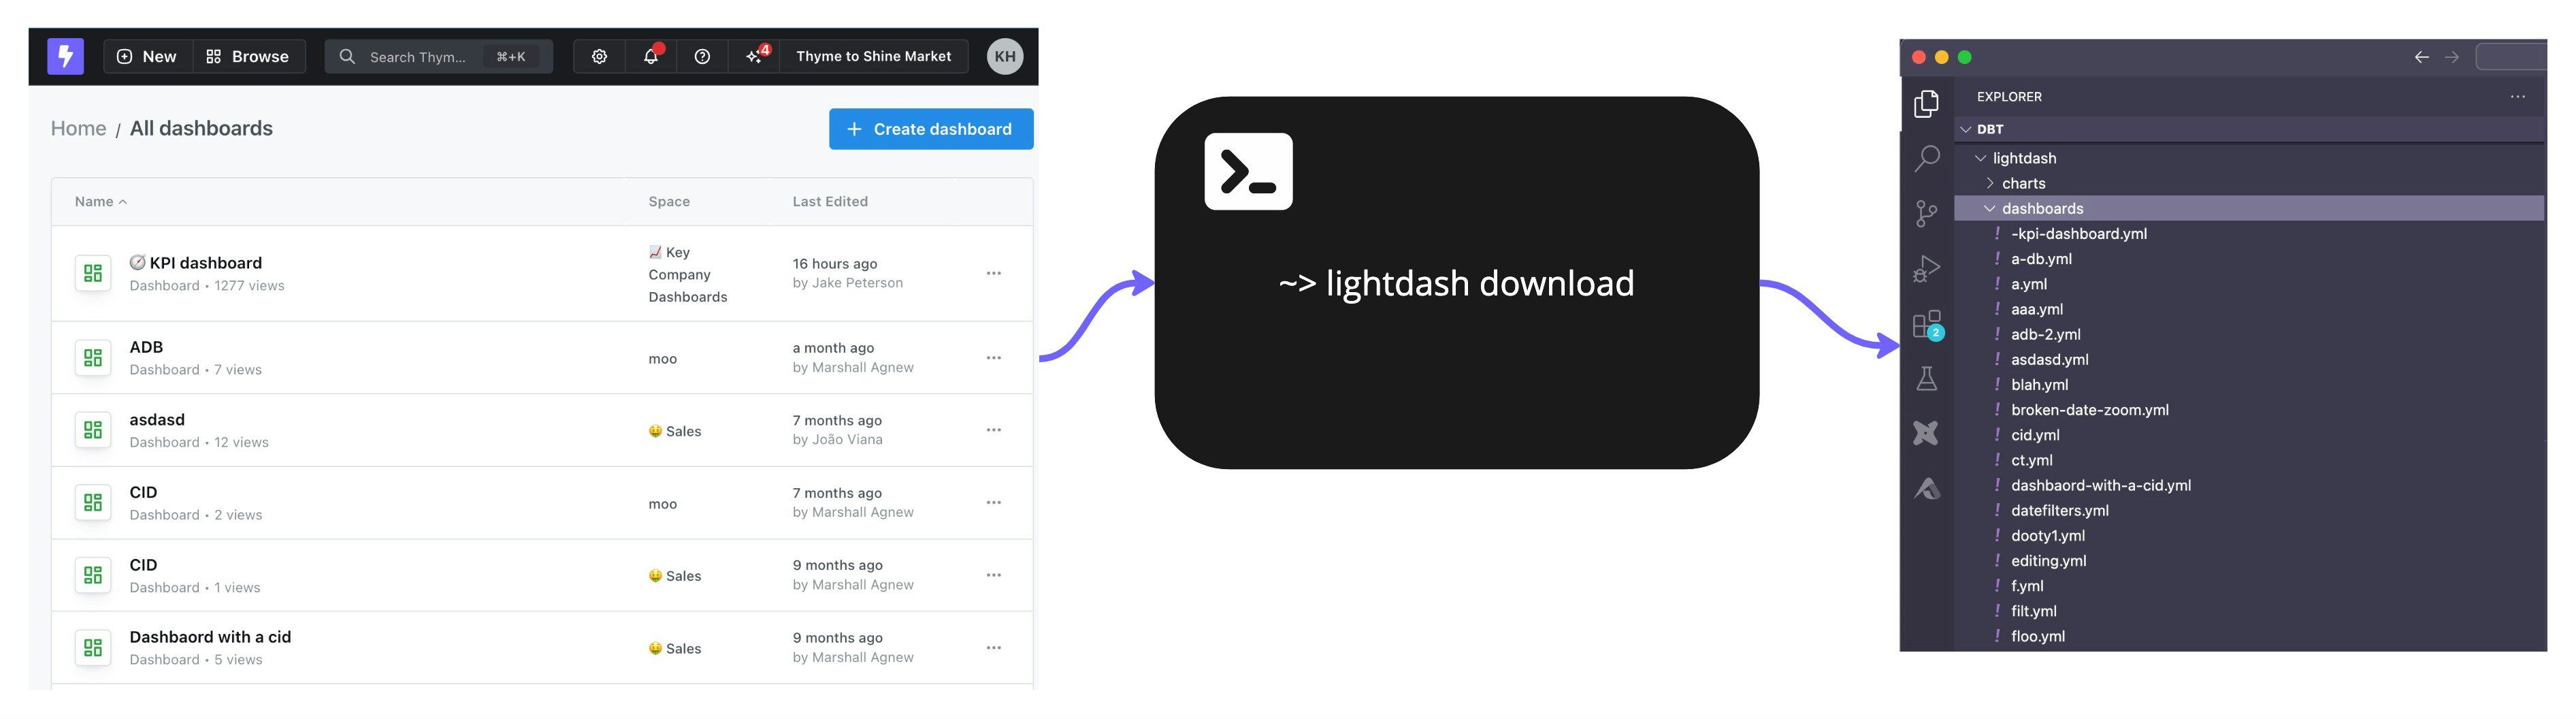
From the Lightdash CLI, you can use the command lightdash download to download all of the charts and dashboards from your Lightdash project as code. All of the charts and dashboards will be written as .yml files to a lightdash directory wherever you’re running the command. E.g. if you’re running this command inside your dbt directory (eg: /home/javi/dbt) then it will create a folder (/home/javi/dbt/lightdash). If you’re running this command in /home/javi/documents it will create the folder in /home/javi/documents/lightdash.
Running lightdash download will overwrite any changes you have locally
For example:
  • I run lightdash download and one of the charts that is downloaded is emea-revenue-per-month.yml
  • I make some changes to the emea-revenue-per-month.yml file and save them
  • I do not upload my changes, they are just saved locally
  • I run lightdash download again
  • The changes I made to emea-revenue-per-month.yml will be overwritten by the latest chart version downloaded from the Lightdash application

Select specific items to download

Use lightdash download -c or lightdash download --charts to select specific charts
If you only want to download specific charts to manage as code, you can use the chart selector in the download command. For example, if I only wanted to download a specific saved chart as code, I would run the command:
lightdash download -c https://app.lightdash.cloud/the-url-to-my-saved-chart
You can use the chart’s SLUG, UUID, or the URL to the saved chart to select the chart.
Use lightdash download -d or lightdash download --dashboards to select specific dashboards
This will download the dashboard and all of the charts in the dashboard as code. For example, if I only wanted to download a specific dashboard as code, I would run the command:
lightdash download -d https://app.lightdash.cloud/the-url-to-my-dashboard
You can use the dashboard’s SLUG, UUID, or the URL to the dashboard to select the dashboard.
To select multiple charts or dashboards, add a space between the items.
For example, this command would select two charts to download:
lightdash download -c https://app.lightdash.cloud/the-url-to-my-first-saved-chart https://app.lightdash.cloud/the-url-to-my-second-saved-chart
You can combine charts and dashboards selection in a single command. For example, this command would download a chart and a dashboard:
lightdash download -c https://app.lightdash.cloud/the-url-to-my-first-saved-chart -d https://app.lightdash.cloud/the-url-to-my-dashboard

Specify a download path

Use lightdash download -p or lightdash download --path to specify a directory to download to By default, lightdash download will create a new lightdash directory in your current working directory and write the content there. You can customize the directory that you write to using lightdash download -p. For example:
lightdash download -p /Users/katiehindson/lightdash/lightdash-analytics/
This will create: /Users/katiehindson/lightdash/lightdash-analytics/charts/ and /Users/katiehindson/lightdash/lightdash-analytics/dashboards and save the content to these new folders. You can also use relative paths like:
lightdash download -p ../

Download an entire project

Use lightdash download --project <project UUID> to download all content from a specific project Running lightdash download will download all content from your current set project (set using lightdash config set-project). But, you can download content from another project using lightdash download --project my-project-uuid. For example:
lightdash download --project 21eef0b9-5bae-40f3-851e-9554588e71a6
You can find a project’s UUID from your Lightdash URL. For example, https://app.lightdash.cloud/projects/123-project-uuid/. Here, the project UUID here is 123-project-uuid .

lightdash upload

lightdash upload updates any content as code to your project. From the Lightdash CLI, you can use the command lightdash upload to upload any changes you’ve made to your charts or dashboards as code. To upload new charts that you’ve created as code to your Lightdash project, you need to run lightdash upload --force

Select specific items to upload

Use lightdash upload -c or lightdash upload --charts to select specific charts
For example, if I only wanted to upload a specific saved chart as code, I would run the command:
lightdash upload -c my-saved-chart-slug
You must specify the chart using the chart’s SLUG.
Use lightdash upload -d or lightdash upload --dashboards to select specific dashboards
For example, if I only wanted to upload a specific dashboard as code, I would run the command:
lightdash upload -d my-dashboard-slug
You must specify the dashboard using the dashboard’s SLUG.
Use --include-charts to upload chart changes when uploading dashboards
When uploading specific dashboards using -d, you can also include any chart changes referenced by those dashboards by adding the --include-charts flag:
lightdash upload -d my-dashboard-slug --include-charts
This automatically includes charts that are referenced in the dashboard tiles, ensuring that both dashboard and chart changes are uploaded together.
To select multiple charts or dashboards, add a space between the items
For example, this command would select two charts to upload:
lightdash upload -c my-saved-chart-1-slug my-saved-chart-2-slug

Specify a path to upload from.

Use lightdash upload -p or lightdash upload --path to specify a directory to upload from. By default, lightdash upload will upload all items you have saved in the lightdash directory in your current working directory. You can customize the directory that you upload from using lightdash upload -p. For example:
lightdash upload -p /Users/katiehindson/lightdash/lightdash-analytics/
This will upload all content from: /Users/katiehindson/lightdash/lightdash-analytics/charts/ and /Users/katiehindson/lightdash/lightdash-analytics/dashboards. You can also use relative paths like:
lightdash download -p ../

Specify a project to upload to

Use lightdash upload --project <project UUID> to upload your content to a specific project. Running lightdash upload will upload all content to your current set project (set using lightdash config set-project). But, you can upload content to another project using lightdash upload --project my-project-uuid. For example:
lightdash upload --project 21eef0b9-5bae-40f3-851e-9554588e71a6
You can find a project’s UUID from your Lightdash URL. For example, https://app.lightdash.cloud/projects/123-project-uuid/. Here, the project UUID here is 123-project-uuid .
Only content as code that you’ve made changes to will be uploaded
For example:
  • I have a chart that I’ve downloaded as code called total-sales-worldwide.yml in my lightdash/ directory
  • I only make changes to that chart’s .yml
  • I run lightdash upload
  • total-sales-worldwide.yml is the only file that gets uploaded because it’s the only file that I made changes to
For example:
  • Katie has a chart that she’s downloaded as code called total-sales-worldwide.yml in her lightdash/ directory
  • She doesn’t make any changes to the chart as code
  • Javi opens the same chart, Total sales worldwide, in the Lightdash application, makes some changes, and saves them
  • Now, Katie’s total-sales-worldwide.yml and the Total sales worldwide chart in the application are different.
  • Katie runs lightdash upload
  • Katie’s total-sales-worldwide.yml does not get uploaded because she made no changes to the chart as code
  • Javi’s changes to the Total sales worldwide chart that he made in the Lightdash application are not overwritten (the version he created is what we see in the Lightdash application)
Content that’s been downloaded as code can still be updated in the Lightdash application
For example:
  • There is a Lightdash project called Stellar Marketing
  • Priyanka runs lightdash download and downloads all of the project’s content as code, including a chart called Total new clients
  • Jake opens the Total new clients chart in the Lightdash application and makes some changes
  • Priyanka doesn’t run lightdash download, so the total-new-clients.yml chart that Priyanka has as code is the old version of the chart, before Jake updated it.
  • Priyanka makes changes to total-new-clients.yml then runs lightdash upload and uploads her changes and overwrites the changes that Jake made in the Lightdash application.
  • Both Jake and Priyanka can update the same chart as code, or in the Lightdash application.

Lightdash content templates

You can use the lightdash download and lightdash upload commands to easily build templates for Lightdash content and reuse these templates to build new or update existing projects.

Creating a new Lightdash project from a Lightdash template

If you’re creating many dbt projects with similar models and want to easily spin up new versions of these projects, but with different table, field, or chart names, then you can use content as code to create a Lightdash template of your project to reuse. To do this, you’ll need to:
  • Take your existing Lightdash project with all of the content that you want to copy.
  • In the CLI, run lightdash download to download all of the content as code from the project
  • Navigate to your new dbt project that you want to connect to Lightdash.
  • Copy-paste over the lightdash/ directory inside your new dbt project with all of the content as code from your template project (or, only copy over the content that you want to use in your new project)
  • Once you’re happy with your content, you’re going to run lightdash config set-project and select your new Lightdash project from the list of projects
  • Then, you’ll run lightdash upload --force to upload all of the content as code you’ve added in your lightdash/ directory to your new Lightdash project

Adding content to an existing project from a Lightdash template

Sometimes, if you’re managing multiple dbt projects with similar models, you want to be able to easily create and manage the same charts and dashboards across all of the projects at the same time. You can do this with content as code to create a Lightdash template project.
  • You want to create a Lightdash project that only contains all of the content that you want to share across your projects
  • From your CLI, you can run lightdash download to download all of this content as code
  • You can then copy-paste the .yml files that get written across to any of the other dbt projects you have where you want to reuse the same charts and dashboards.
  • Once you’ve copied over any content that you wanted to manage across projects, from the CLI, you should run lightdash config set-project and select the project where you’ve added these new charts/dashboards as code to.
  • Then, you should run lightdash upload to upload all of the new content as code.

Using community templates

Alongside making templates from your own project, you can also use templates from the lightdash-templates repo to quickly build dashboards on top of common datasets. For example, if you are using BigQuery as your data warehouse, you can use the community templates to build a usage tracking dashboard in a matter of minutes. There are detailed instructions within the repo, but the general steps are as follows:
  • Identify the content you wish to implement, and navigate to the relevant folder.
  • Copy the content from the Lightdash folder into your dbt project.
  • Run lightdash upload --force to push your new content to Lightdash.
Note that these templates still rely on access to an underlying dbt model containing the relevant data, you might need to create or adjust this following the instructions in the lightdash-templates repo.

yml reference

This section provides a comprehensive reference of all possible configurations for Charts and Dashboards defined as YAML/JSON. The best way to start is often to create your content in the Lightdash UI, download it, and examine the structure. Below you’ll find detailed documentation of all available properties and configurations.
If you have additional questions beyond what’s covered here, you can always reach out to our support team for more details

Chart as Code

Required Fields

version: 1 # Must be 1
name: "My Chart" # Display name
tableName: "orders" # Explore/table name
slug: "my-chart" # URL-safe identifier (lowercase, hyphens only)
spaceSlug: "sales/reports" # Path to containing space
metricQuery: # Query configuration (see below)
  exploreName: "orders"

Optional Top-Level Fields

description: "Chart description"
dashboardSlug: "my-dashboard" # If saved within a dashboard
updatedAt: "2025-10-10T12:00:00Z" # Readonly timestamp
downloadedAt: "2025-10-10T12:00:00Z" # Readonly timestamp
chartConfig: {} # Visualization config (see below)
tableConfig: {} # Table view config (see below)
pivotConfig: {} # Pivot config (see below)

Metric Query Configuration

Core Query Fields

metricQuery:
  exploreName: "orders"

  dimensions:
    - "orders_created_date"
    - "customers_name"

  metrics:
    - "orders_total_revenue"
    - "orders_count"

  limit: 500 # Max rows to return

Filters

Structure:
metricQuery:
  filters:
    dimensions: # Filter on dimensions
      and: # AND logic
        - target:
            fieldId: "orders_status"
          operator: "equals"
          values: ["completed"]
          required: false
      or: # OR logic
        - target:
            fieldId: "orders_region"
          operator: "include"
          values: ["US", "UK"]

    metrics: # Filter on metrics
      and:
        - target:
            fieldId: "orders_revenue"
          operator: "greaterThan"
          values: [1000]

    tableCalculations: # Filter on table calculations
      and: []
All Filter Operators:
  • equals
  • notEquals
  • isNull
  • notNull
  • startsWith
  • endsWith
  • include
  • doesNotInclude
  • lessThan
  • lessThanOrEqual
  • greaterThan
  • greaterThanOrEqual
  • inThePast
  • notInThePast
  • inTheNext
  • inTheCurrent
  • notInTheCurrent
  • inBetween
  • notInBetween

Sorts

metricQuery:
  sorts:
    - fieldId: "orders_created_date"
      descending: true
    - fieldId: "orders_revenue"
      descending: false

Table Calculations

Custom calculations on query results (like window functions):
metricQuery:
  tableCalculations:
    - name: "revenue_running_total"
      displayName: "Revenue Running Total"
      sql: "SUM(${orders.revenue}) OVER (ORDER BY ${orders.created_date})"
      type: "number" # Options: string, number, date, boolean
      format:
        type: "currency" # Options: default, currency, number, percent
        round: 2
        currency: "USD"
        separator: "commaPeriod" # See format options below

Additional Metrics (Ad-hoc)

Custom metrics not in the dbt model:
metricQuery:
  additionalMetrics:
    - name: "custom_avg_revenue"
      label: "Average Revenue Per Order"
      description: "Custom calculation"
      sql: "${TABLE}.revenue"
      table: "orders"
      type: "average" # Options: count, count_distinct, sum, average, min, max
      baseDimensionName: "revenue"
      formatOptions:
        type: "currency"
        separator: "commaPeriod"

Metric Overrides

Override formatting for existing metrics:
metricQuery:
  metricOverrides:
    orders_revenue:
      formatOptions:
        type: "currency"
        round: 0
        currency: "EUR"
        separator: "periodComma"

Custom Dimensions

Custom dimensions allow you to create new dimensions on-the-fly, either by binning existing dimensions or writing custom SQL. Types:
  • bin - Create bins/ranges from an existing dimension
  • sql - Write custom SQL to create a dimension
Bin Dimension (Binning):
metricQuery:
  customDimensions:
    - id: "amount_range"
      name: "Amount Range"
      type: "bin"
      table: "payments"
      dimensionId: "payments_amount"
      binType: "fixed_number" # Options: fixed_number, fixed_width, custom_range
      binNumber: 5 # For fixed_number: number of bins to create
      # binWidth: 1000  # For fixed_width: width of each bin
      # customRange:     # For custom_range: explicit ranges
      #   - from: undefined
      #     to: 100
      #   - from: 100
      #     to: 500
      #   - from: 500
      #     to: undefined
Bin Types:
  • fixed_number - Split data into N equal bins (uses binNumber)
  • fixed_width - Create bins of fixed width (uses binWidth)
  • custom_range - Define custom bin ranges (uses customRange)
SQL Dimension (Custom SQL):
metricQuery:
  customDimensions:
    - id: "custom_category"
      name: "Custom Category"
      type: "sql"
      table: "orders"
      sql: 'CASE WHEN ${orders.revenue} > 1000 THEN "High" ELSE "Low" END'
      dimensionType: "string" # Options: string, number, timestamp, date, boolean

Chart Configuration

Chart Types

chartConfig:
  type: "cartesian" # Options: cartesian, pie, table, big_number, funnel, treemap, custom
  config: {} # Type-specific configuration

1. Cartesian Charts (Line, Bar, Area, Scatter)

Chart Kinds within Cartesian:
  • line - Line chart
  • horizontal_bar - Horizontal bar chart
  • vertical_bar - Vertical bar chart
  • scatter - Scatter plot
  • area - Area chart
  • mixed - Mixed chart types
chartConfig:
  type: "cartesian"
  config:
    layout:
      xField: "orders_created_date"
      yField:
        - "orders_revenue"
        - "orders_count"
      flipAxes: false # true for horizontal bar
      showGridX: true
      showGridY: true
      showXAxis: true
      showYAxis: true

    eChartsConfig:
      series:
        - encode:
            xRef:
              field: "orders_created_date"
            yRef:
              field: "orders_revenue"
          type: "bar" # Options: line, bar, scatter, area
          name: "Revenue"
          color: "#5470c6"
          yAxisIndex: 0
          stack: "total" # Stack identifier for stacked charts
          stackLabel:
            show: true
          label:
            show: true
            position: "top" # Options: left, top, right, bottom, inside
          hidden: false
          areaStyle: {} # Include for area chart
          showSymbol: true # Show data point markers
          smooth: false # Smooth line curves
          markLine: # Reference lines
            data:
              - yAxis: "1000"
                name: "Target"
                uuid: "unique-id"
                lineStyle:
                  color: "#ff0000"
                label:
                  formatter: "Target: {c}"
                  position: "end" # Options: start, middle, end
              - dynamicValue: "average" # Dynamic average line

      xAxis:
        - name: "Date"
          min: "0"
          max: "100"
          inverse: false
          rotate: 0
          sortType: "default" # Options: default, bar_totals

      yAxis:
        - name: "Revenue ($)"
          min: "0"
          max: "auto"
          minOffset: "0"
          maxOffset: "10"
          inverse: false

      legend:
        show: true
        type: "plain" # Options: plain, scroll
        orient: "horizontal" # Options: horizontal, vertical
        top: "10%"
        right: "10%"
        bottom: "auto"
        left: "auto"
        width: "auto"
        height: "auto"
        align: "auto" # Options: auto, left, right
        icon: "circle" # Options: circle, rect, roundRect, triangle, diamond, pin, arrow, none

      grid:
        containLabel: true
        top: "10%"
        right: "10%"
        bottom: "10%"
        left: "10%"
        width: "auto"
        height: "auto"

    metadata:
      series_key:
        color: "#5470c6"

2. Big Number

chartConfig:
  type: "big_number"
  config:
    label: "Total Revenue"
    style: "default" # Options: default, compact, millions, K (thousands), M (millions), B (billions), T (trillions)
    selectedField: "orders_revenue"
    showBigNumberLabel: true
    showComparison: true
    comparisonFormat: "percentage" # Options: raw, percentage
    flipColors: false
    comparisonLabel: "vs last month"

3. Pie Chart

chartConfig:
  type: "pie"
  config:
    groupFieldIds:
      - "orders_status"
    metricId: "orders_count"
    isDonut: true
    valueLabel: "outside" # Options: hidden, inside, outside
    showValue: true
    showPercentage: true
    groupLabelOverrides:
      completed: "Completed Orders"
    groupColorOverrides:
      completed: "#00ff00"
    groupValueOptionOverrides:
      completed:
        valueLabel: "inside"
        showValue: false
    groupSortOverrides:
      - "completed"
      - "pending"
    showLegend: true
    legendPosition: "horizontal" # Options: horizontal, vertical
    legendMaxItemLength: 30
    metadata:
      completed:
        color: "#5470c6"

4. Funnel Chart

chartConfig:
  type: "funnel"
  config:
    dataInput: "row" # Options: row, column
    fieldId: "funnel_stage"
    metadata:
      stage1:
        color: "#5470c6"
    labelOverrides:
      stage1: "Awareness"
    colorOverrides:
      stage1: "#ff0000"
    labels:
      position: "inside" # Options: inside, left, right, hidden
      showValue: true
      showPercentage: true
    showLegend: true
    legendPosition: "horizontal" # Options: horizontal, vertical

5. Treemap

chartConfig:
  type: "treemap"
  config:
    visibleMin: 10
    leafDepth: 2
    groupFieldIds:
      - "product_category"
      - "product_name"
    sizeMetricId: "orders_quantity"
    colorMetricId: "orders_revenue"
    startColor: "#ffffff"
    endColor: "#ff0000"
    useDynamicColors: true
    startColorThreshold: 0
    endColorThreshold: 1000

6. Table Chart

chartConfig:
  type: "table"
  config:
    showColumnCalculation: true
    showRowCalculation: true
    showTableNames: true
    hideRowNumbers: false
    showResultsTotal: true
    showSubtotals: true
    metricsAsRows: false
    columns:
      orders_revenue:
        visible: true
        name: "Total Revenue"
        frozen: true
    conditionalFormattings:
      - target: "orders_revenue"
        operator: "greaterThan"
        value: 1000
        color: "#00ff00"

7. Custom Visualization

chartConfig:
  type: "custom"
  config:
    spec:
      # Custom visualization spec (varies)

Table Configuration

tableConfig:
  columnOrder:
    - "orders_created_date"
    - "orders_revenue"
    - "orders_count"

Pivot Configuration

pivotConfig:
  columns:
    - "orders_status"
    - "orders_region"

Dashboard as Code

Required Fields

version: 1
name: "Sales Dashboard"
slug: "sales-dashboard"
spaceSlug: "sales/reports"
tiles: [] # Array of tiles
filters: # Dashboard filters
  dimensions: []
tabs: [] # Array of tabs

Optional Top-Level Fields

description: "Dashboard description"
updatedAt: "2025-10-10T12:00:00Z" # Readonly
downloadedAt: "2025-10-10T12:00:00Z" # Readonly

Tiles

Tile Types

  1. Saved Chart Tile
  2. Markdown Tile
  3. Loom Video Tile

1. Saved Chart Tile

tiles:
  - uuid: "optional-uuid" # Auto-generated if omitted
    tileSlug: "revenue-chart" # Optional slug
    type: "saved_chart"
    x: 0 # Grid position (horizontal)
    y: 0 # Grid position (vertical)
    h: 9 # Height in grid units
    w: 15 # Width in grid units
    tabUuid: null # Tab UUID or null for default tab
    properties:
      chartSlug: "my-chart-slug" # Required
      chartName: "Revenue Chart"
      title: "Custom Title Override"
      hideTitle: false

2. Markdown Tile

tiles:
  - type: "markdown"
    x: 0
    y: 0
    h: 4
    w: 12
    tabUuid: null
    properties:
      title: "Introduction" # Required
      content: | # Required
        # Welcome
        This is **markdown** content.
      hideTitle: false

3. Loom Video Tile

tiles:
  - type: "loom"
    x: 0
    y: 0
    h: 8
    w: 12
    tabUuid: null
    properties:
      title: "Tutorial Video" # Required
      url: "https://loom.com/..." # Required (valid URI)
      hideTitle: false

Dashboard Tabs

tabs:
  - uuid: "tab-1" # Required
    name: "Overview" # Required
    order: 0 # Required (sort order, 0-based)

  - uuid: "tab-2"
    name: "Details"
    order: 1

Dashboard Filters

filters:
  dimensions:
    - operator: "equals" # Required (see all operators above)
      target: # Required
        fieldId: "orders_status"
        fieldName: "status"
        tableName: "orders"
        isSqlColumn: false
        fallbackType: "string" # Options: string, number, boolean, date, timestamp
      values:
        - "completed"
      settings: # For date/time filters
        unitOfTime: "days" # Options: milliseconds, seconds, minutes, hours, days, weeks, months, quarters, years
        completed: true
      disabled: false
      required: false
      label: "Order Status"
      singleValue: false # Only accept single value
      tileTargets: # Per-tile filter mapping
        tile-uuid-1:
          fieldId: "different_field_id"
          tableName: "different_table"
        tile-uuid-2: false # Disable filter for this tile

  metrics: # Same structure as dimensions
    - operator: "greaterThan"
      target:
        fieldId: "orders_revenue"
        tableName: "orders"
      values: [1000]

  tableCalculations: # Same structure as dimensions
    - operator: "notNull"
      target:
        fieldId: "calc_field"
        tableName: "orders"

Shared Configurations

Format Options

Format Types:
  • default - Use field’s default formatting
  • currency - Currency formatting
  • number - Number formatting
  • percent - Percentage formatting
Separator Styles:
  • default - Use default separators
  • commaPeriod - 1,000.00 (US style)
  • spacePeriod - 1 000.00 (European style)
  • periodComma - 1.000,00 (European style)
  • spaceComma - 1 000,00 (European style)
Example:
formatOptions:
  type: "currency"
  round: 2 # Decimal places
  currency: "USD" # ISO currency code
  separator: "commaPeriod"

Compact/Alias Styles (Big Number)

  • default - Full number
  • compact - Compact notation (1.2K, 3.4M)
  • K - Thousands
  • M - Millions
  • B - Billions
  • T - Trillions

Slug Pattern

All slugs must match: ^[a-z0-9]+(?:-[a-z0-9]+)*$ Valid:
  • my-chart
  • sales-dashboard-2024
  • revenue-by-region
Invalid:
  • My-Chart (uppercase)
  • my_chart (underscore)
  • my--chart (double hyphen)

Default Colors

ECharts Default Palette:
  1. #5470c6 (blue)
  2. #fc8452 (orange)
  3. #91cc75 (green)
  4. #fac858 (yellow)
  5. #ee6666 (red)
  6. #73c0de (light blue)
  7. #3ba272 (teal)
  8. #9a60b4 (purple)
  9. #ea7ccc (pink)

Complete Examples

Minimal Chart Example

version: 1
name: "Revenue Trend"
tableName: "orders"
slug: "revenue-trend"
spaceSlug: "sales"
metricQuery:
  exploreName: "orders"
  dimensions:
    - "orders_created_date"
  metrics:
    - "orders_revenue"
chartConfig:
  type: "cartesian"
version: 1
name: "Revenue Analysis"
description: "Monthly revenue with targets"
tableName: "orders"
slug: "revenue-analysis"
spaceSlug: "sales/monthly"
metricQuery:
  exploreName: "orders"
  dimensions:
    - "orders_created_month"
  metrics:
    - "orders_revenue"
  filters:
    dimensions:
      and:
        - target:
            fieldId: "orders_status"
          operator: "equals"
          values: ["completed"]
  sorts:
    - fieldId: "orders_created_month"
      descending: false
  limit: 12
  tableCalculations:
    - name: "revenue_growth"
      displayName: "Revenue Growth %"
      sql: "(${orders.revenue} - LAG(${orders.revenue}) OVER (ORDER BY ${orders.created_month})) / LAG(${orders.revenue}) OVER (ORDER BY ${orders.created_month}) * 100"
      type: "number"
      format:
        type: "percent"
        round: 1
chartConfig:
  type: "cartesian"
  config:
    layout:
      xField: "orders_created_month"
      yField:
        - "orders_revenue"
        - "revenue_growth"
    eChartsConfig:
      series:
        - encode:
            xRef:
              field: "orders_created_month"
            yRef:
              field: "orders_revenue"
          type: "bar"
          color: "#5470c6"
          label:
            show: true
            position: "top"
          markLine:
            data:
              - yAxis: "100000"
                name: "Target"
                uuid: "target-line"
                lineStyle:
                  color: "#ff0000"
      legend:
        show: true
        orient: "horizontal"
        top: "5%"

Minimal Dashboard Example

version: 1
name: "Sales Overview"
slug: "sales-overview"
spaceSlug: "sales"
tiles:
  - type: "saved_chart"
    x: 0
    y: 0
    h: 9
    w: 15
    tabUuid: null
    properties:
      chartSlug: "revenue-trend"
filters:
  dimensions: []
tabs:
  - uuid: "default-tab"
    name: "Overview"
    order: 0
version: 1
name: "Executive Dashboard"
description: "Key metrics and trends"
slug: "executive-dashboard"
spaceSlug: "executive/reports"
tiles:
  - type: "markdown"
    x: 0
    y: 0
    h: 3
    w: 24
    tabUuid: "tab-1"
    properties:
      title: "Dashboard Overview"
      content: |
        # Executive Summary
        Key performance indicators for Q4 2024.

  - type: "saved_chart"
    x: 0
    y: 3
    h: 9
    w: 12
    tabUuid: "tab-1"
    properties:
      chartSlug: "revenue-trend"
      title: "Revenue Trend"

  - type: "saved_chart"
    x: 12
    y: 3
    h: 9
    w: 12
    tabUuid: "tab-1"
    properties:
      chartSlug: "customer-growth"

  - type: "loom"
    x: 0
    y: 12
    h: 8
    w: 24
    tabUuid: "tab-2"
    properties:
      title: "Monthly Review"
      url: "https://loom.com/share/abc123"

filters:
  dimensions:
    - operator: "inTheCurrent"
      target:
        fieldId: "orders_created_date"
        tableName: "orders"
        fallbackType: "date"
      settings:
        unitOfTime: "quarters"
        completed: false
      required: true
      label: "Time Period"
      tileTargets:
        tile-1:
          fieldId: "orders_created_date"
          tableName: "orders"

tabs:
  - uuid: "tab-1"
    name: "Overview"
    order: 0
  - uuid: "tab-2"
    name: "Deep Dive"
    order: 1

Important Notes

  1. UUIDs: Most UUIDs are optional and auto-generated if not provided
  2. Readonly Fields: updatedAt and downloadedAt are system-managed
  3. Slug Validation: All slugs are validated against the pattern ^[a-z0-9]+(?:-[a-z0-9]+)*$
  4. Grid System: Dashboard tiles use a 24-column grid system
  5. Default Tile Size: Charts default to {h: 9, w: 15}, big numbers to {h: 6, w: 9}
  6. Filter Inheritance: Dashboard filters can be disabled or remapped per tile
  7. Schema Validation: Both YAML and JSON formats validate against JSON Schema

JSON schema validation in VSCode

When building content as code in YAML format, you can enable JSON schema validation in VSCode to get autocomplete suggestions and validation. This helps you understand what properties are supported and ensures your YAML files are correctly formatted. To set this up:
  1. Install the YAML extension for VSCode
  2. Open your VSCode user settings in JSON format (press Cmd/Ctrl + Shift + P and search for “Preferences: Open User Settings (JSON)”)
  3. Add the following configuration:
VSCode settings.json
"[yaml]": {
  "editor.defaultFormatter": "redhat.vscode-yaml"
},
"yaml.schemas": {
  "https://raw.githubusercontent.com/lightdash/lightdash/refs/heads/main/packages/common/src/schemas/json/chart-as-code-1.0.json": [
    "path_to_charts/charts/*.yml"
  ],
  "https://raw.githubusercontent.com/lightdash/lightdash/refs/heads/main/packages/common/src/schemas/json/dashboard-as-code-1.0.json": [
    "path_to_dashboards/dashboards/*.yml"
  ]
}
Make sure to update path_to_charts/charts/*.yml and path_to_dashboards/dashboards/*.yml to match the actual paths where your content as code files are stored (e.g., lightdash/charts/*.yml and lightdash/dashboards/*.yml).
I